 South Africa - Institutional

Investment views
The winds of hope are blowing
"The Fed’s actions reverberate across every corner of the global financial system."— Ben Bernanke, Former Chairman of the Federal Reserve
The Quick Take
- The robust start to the US rate-cutting cycle significantly impacted markets, seeing record highs on the ALSI
- The formation of the GNU has helped reduce the risk premium on SA bonds, helping them outperform their EM counterparts
- We see SA’s policy rate on a solid downward trend into 2025 with inflation comfortably within the target range, but with upside risks
- The biggest risk to SA’s recovery and future prosperity remains the fiscus, which needs much higher nominal growth to deal with its laundry list of woes.

Risky assets rejoiced in chorus at the near synchronous start to the global rate cutting cycle. The US Federal Reserve Board (the Fed) provided more reason for exuberance, with a jumbo half a percentage point reduction in lending rates, to mark the start of the rate cutting cycle. This was the first time in over 20 years that a US cutting cycle, outside of hot wartimes or a crisis, has started with such fervour. Global bond markets embraced the chords of jubilation from policy makers, as they rallied into the event, with almost every bond market in the world lower from a yield perspective over the quarter. South African assets, which have been enjoying renewed investor enthusiasm since the formation of the coalition government, topped the performance tables.
South African (SA) bonds returned 10.54% over the quarter, bringing their year-to-date (ytd) and one-year returns to 16.68% and 26.14%, respectively. As can be expected, cash has significantly lagged bond returns, by more than 10% ytd and one year. Falling inflation has been dreadful for inflation-linked bonds (ILBs). They have managed to outperform cash over all periods; however, they have returned half of their nominal equivalents (4.75% quarter-to-date [qtd], 6.89% ytd, 13.38% over 12 months). The rand has gained c.6% against the dollar since the start of the year, outperforming its emerging market peer group. This has meant that despite the strong rally in global bond markets, local bonds have outperformed global bonds significantly (FTSE World Government Bond Index returned 6.95% qtd, 2.72% ytd and 11.02% over 12 months in dollars). The primary reason for the strong performance of the local bond market has been a reduction in the risk premium post elections, which spurred a c.250 basis point (bps) rally (compression) in bond yields.
The SA 10-year bond is currently at c. 10%, which is still materially above its average of 9% in the previous decade. In determining the sustainability of these levels and the possibility of a further compression in the bond yields, one has to separate cyclical and structural factors to determine whether the current valuation is commensurate with the risks and tailwinds the economy faces over the longer term. Coronation’s bottom up valuation-driven research process focuses on the long-term factors that drive the local economy. This enables us to arrive at a determination of a through-the-cycle estimate of fair value for various assets with due consideration to these factors.
SWINGS AND ROUNDABOUTS
There are two key local drivers for SA bond yields. Firstly, the path of inflation and its implication for monetary policy and, secondly, the health of government finances as presented in the fiscal accounts.
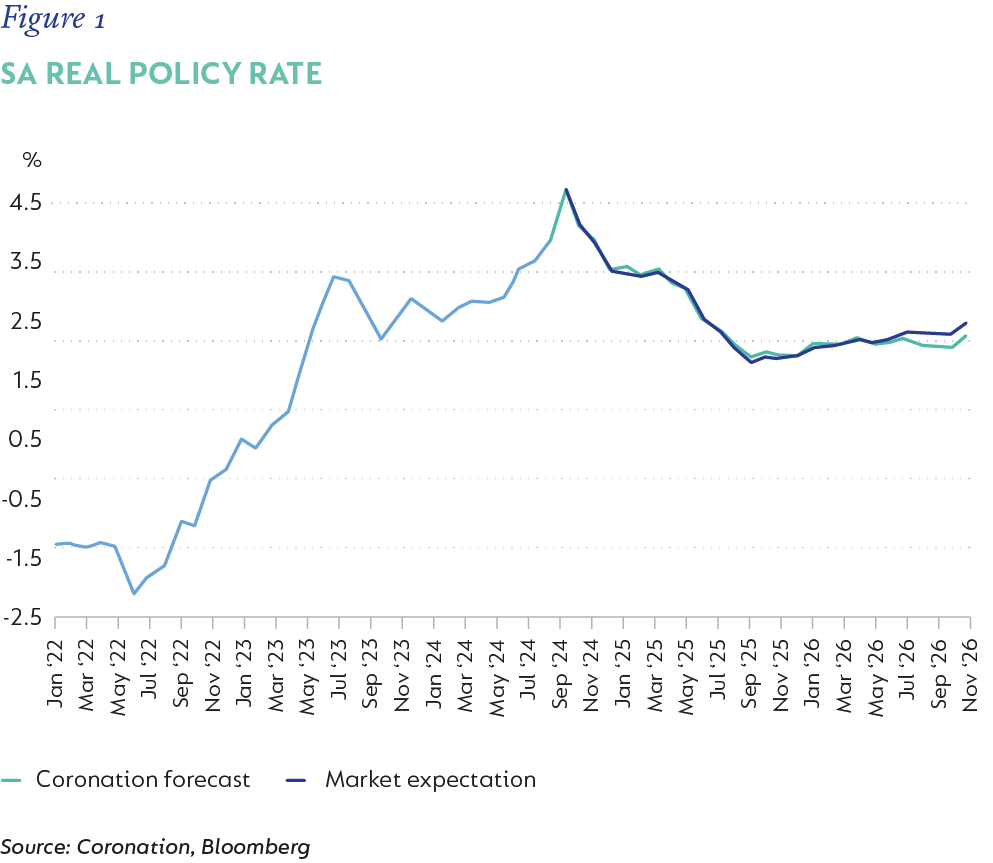
Inflation has seen a dramatic shift from a year ago. Food and fuel prices have retreated significantly, and the strength of the rand has dampened imported inflation. Loadshedding has become less of a constraint on doing business, however, this has, to a certain extent, been offset by the deterioration in the national logistics infrastructure. Our expectations are now for inflation to average 4.5% in 2024 (getting close to 3% in October and November), 4.2% in 2025 and 4.8% in 2026. This implies inflation averages 4.5% in 2025 and 2026 which, based on the South African Reserve Bank (SARB)’s estimate of the neutral real policy rate of 2.5%, places the neutral repo rate at 7%. Our expectations align with this, as we look for the SARB to continue easing rates in 25bps increments until 7% is achieved in May 2025. The risks to this are for a slower cutting cycle or a cycle that is not as deep. These risks emanate from higher administered prices (water, electricity), higher fuel prices due to continued geopolitical tensions, and an early announcement of a reduction in the inflation target to c. 3%. Current market pricing fully discounts a 7% repo rate (Figure 1).
The major longer-term risk for the SA economy has and will continue to be the fiscus. SA’s problems are threefold: 1) slow growth which has led to subdued tax revenue; 2) expenditure pressures in the form of SOE bailouts and a bloated wage bill; and 3) a cost of funding that has far exceeded our growth rate. A core issue for the fiscus is that the nominal growth rate (real growth + inflation) for SA remains far too low. The renewed optimism in the reform path following the announcement of the GNU, could see real growth accelerate towards 2% by 2026 (higher than the 1%-1.5% previously forecast), and even higher post this if the momentum is maintained. However, with inflation forecast to be lower (4.5%) than previously expected (5%-5.5%), this offsets a large part of the increase in real growth, implying nominal growth will be basically unchanged. Furthermore, expenditure pressure has not eased. Currently, the public sector worker union is demanding a 12% wage increase versus the 4.5% National Treasury has penciled in for 2025/2026 and deteriorating infrastructure (rail and water) at both the national and municipal level suggests the need for more (not less) money to be spent. Finally, despite the reduction in risk premium, SA is still funding itself in the bond market at levels in excess of 10%, which is much better than the 11% seen pre-election but unfortunately still well above the best expectations of nominal growth going forward. As such, we expect deficits to remain wide and SA to continue to accumulate debt, putting debt to GDP above 80% in 2029/2030, leaving the outlook for government finances less constructive than sentiment would suggest.
THE US 10-YEAR
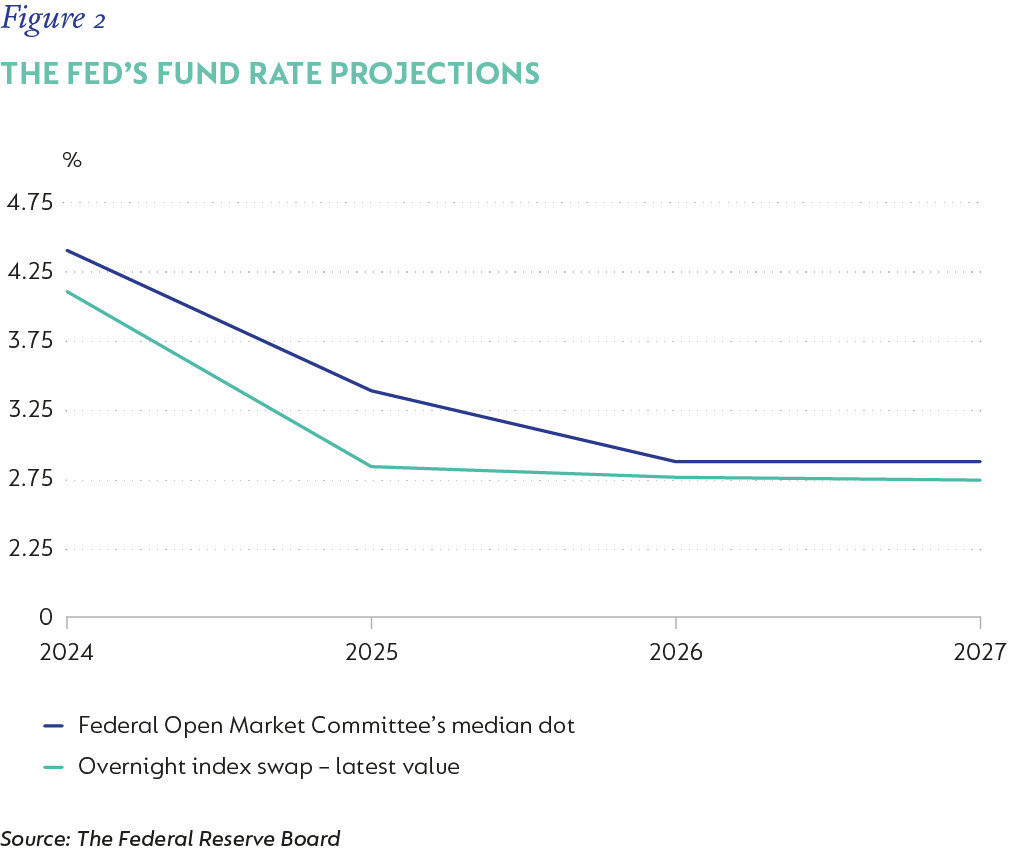
The path of US monetary policy as well as the level of the US 10-year bond has a significant impact on risky assets and therefore emerging market bond yields. Currently, the market pricing of monetary policy in the US is more dovish than the actual Fed projections (Figure 2), which suggests room for disappointment. The monetary policy tailwinds that have helped US bond yields lower could have run their course or even reverse.
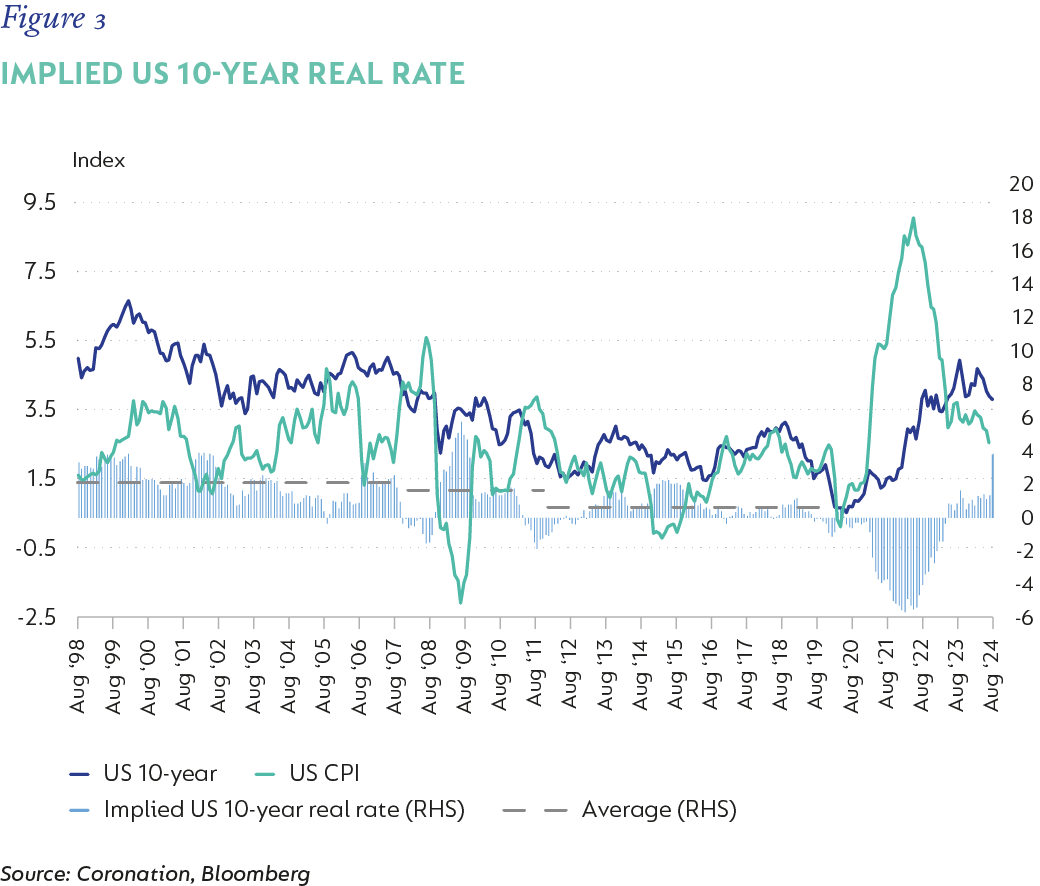
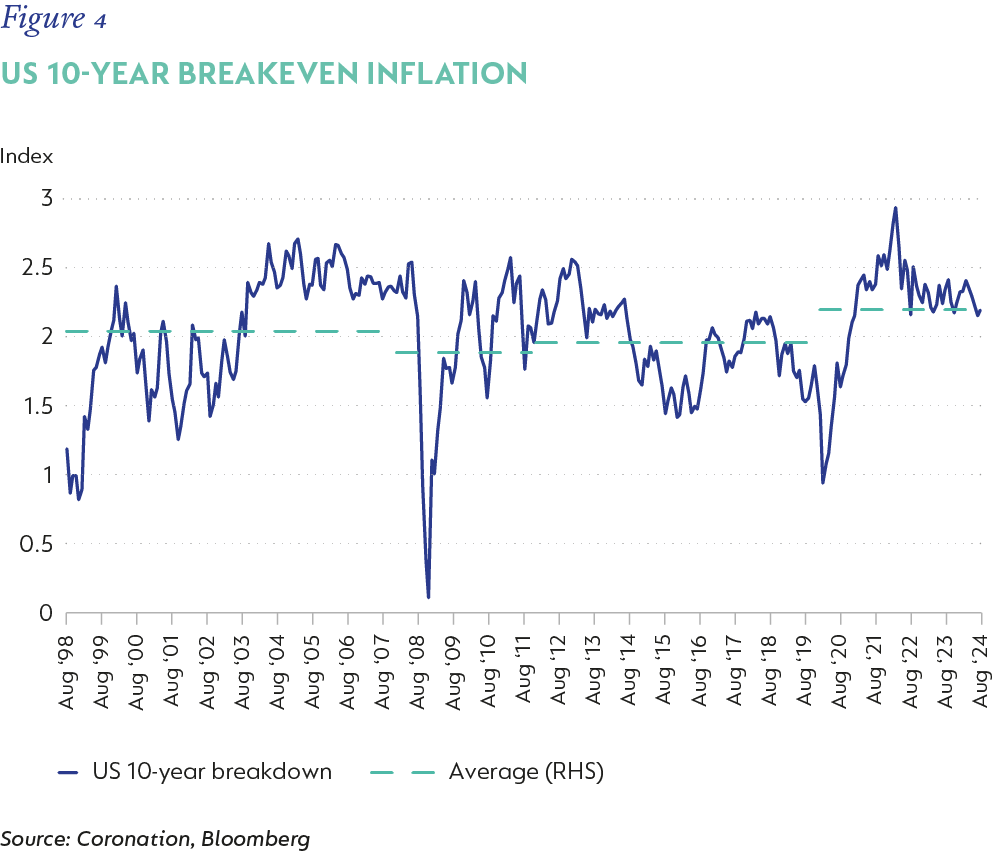
The implied real yield of the US 10-year bond (US 10-year) provides one with an indication of what its long-term term premium should be relative to inflation. This implied real yield was as high as 2% pre-Global Financial Crisis, then moderated to 1.5% in its aftermath, and was closer to 0.5% leading up to Covid (Figure 3). A key driver of this moderation was the use of quantitative easing measures, which artificially suppressed real bond yields. The Fed has moved from quantitative easing to quantitative tightening in the last few years, removing a key distorting force of the last decade. This is not to say that the implied real yield is going to shoot back up to 2%, but it is very likely that it settles somewhere between 1.5%-2%. The market’s predicting power of long-term inflation has been decent over time, as represented by the US 10-year breakeven inflation (Figure 4). The structural changes in the US economy post-Covid, both on the inflation and debt side, suggests longer-term inflation should be expected to be higher than previous experience, with market predictions closer to 2.25% over the long term. This implies a fair value for the US 10-year of around 3.75%-4.25%, versus a level of 3.78% at the end of the quarter, which implies limited room for yield compression.
SA BOND ANATOMY
SA bond yields can be decomposed into a global risk-free rate (US 10-year yield), the inflation differential and the credit spread. We have already established that the fair US 10-year yield (widely seen as the global risk-free rate) is 3.75%-4.25% (we will use a 4% average) and that projected long-term US inflation is 2.25%. Furthermore, SA inflation is expected to average 4.5% over the next two years, so the inflation differential is 2.25% (4.5% SA inflation minus 2.25% US inflation). The SA credit spread requires further investigation.
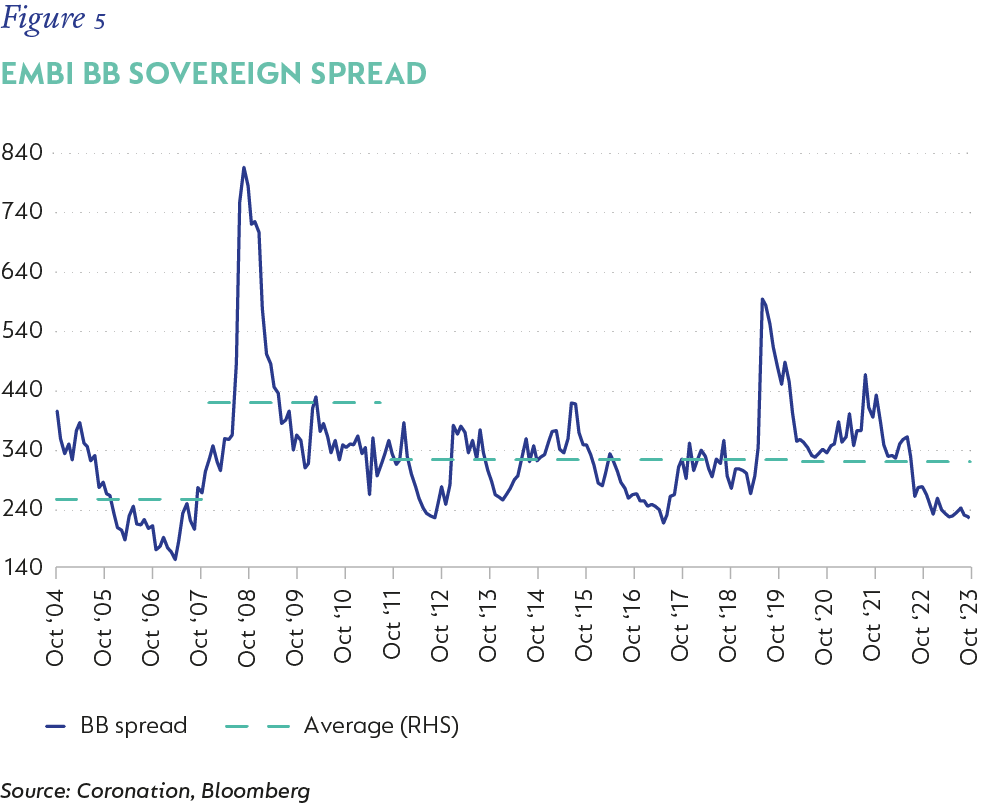
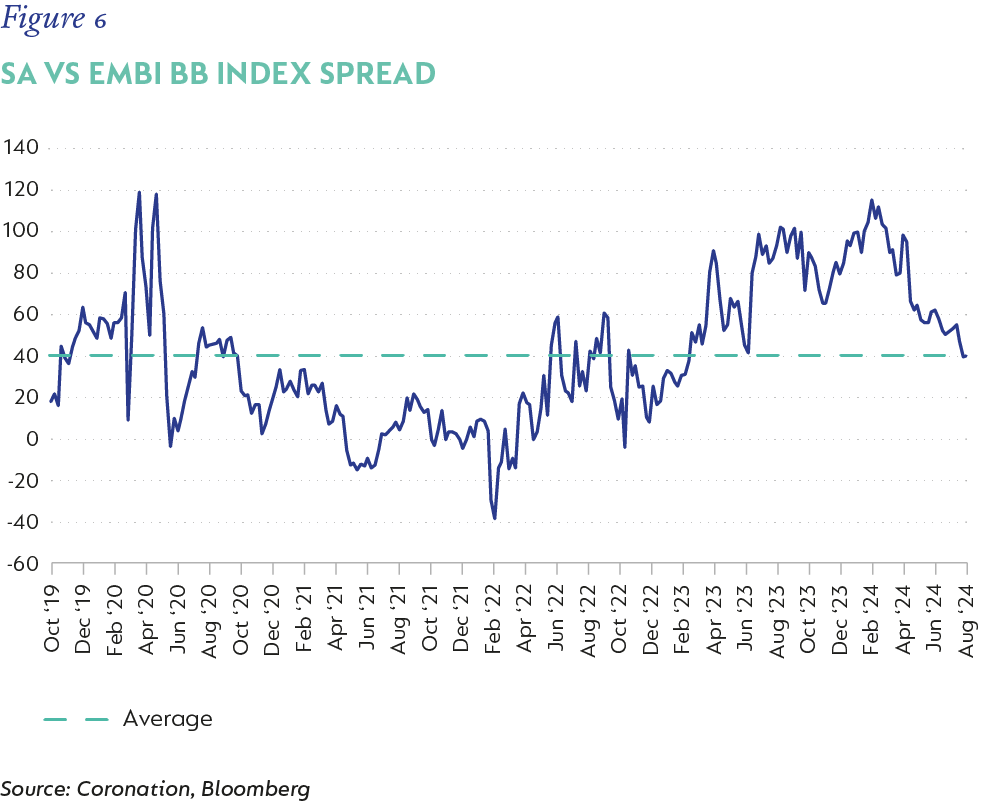
SA was downgraded to a BB rating in February 2020 and since then has traded at a spread to the Emerging Markets Bond Index (EMBI) BB sovereign spread (Figure 5). Recent compression in the risk premium has taken the spread back to its average. There is an argument to be made that SA should trade tighter than average (40bps) after recent events, but as we have showed earlier, besides inflation, the fiscal risk still remains high, indicating the need for some risk premium. The recent turn in global risk sentiment has already resulted in a compression of the BB sovereign spread to the tightest levels seen since the peak of global monetary accommodation in the last decade (Figure 6). It is easy to argue that a decompression from current levels (225bps) to the long-term average (330bps) is more likely. This would put the expected SA credit spread at 370bps, maybe slightly tighter towards 350bps if a more optimistic view were to be taken.
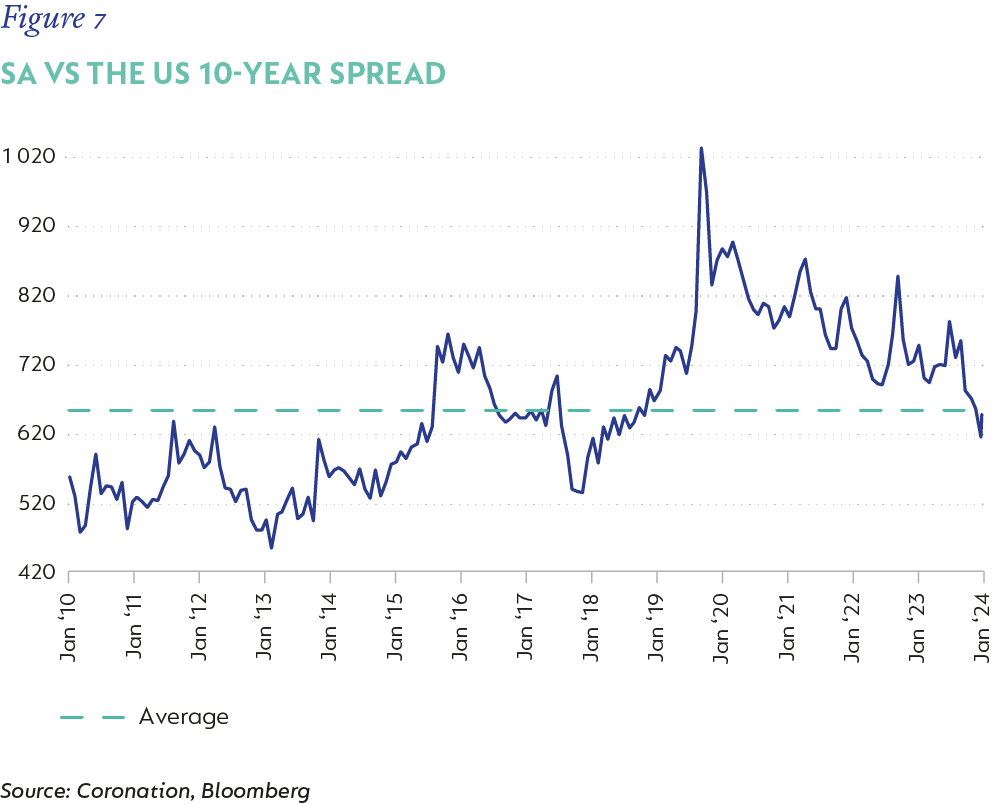
The implication is therefore a fair value of SA 10-year bonds of 9.75%-9.95% (4% + 4.5% - 2.25% + (3.5% or 3.75%)), versus a current level of 9.95%. It is important to note, however, that the expectations used in the above calculation can be thought of to be on the constructive side. A further factor that suggests the SA 10-year bond valuation is close to fully valued, is its relative yield spread to the US 10-year (Figure 7), which is now below its longer-term average and below levels achieved before Covid, when the SA fiscal picture was significantly better.
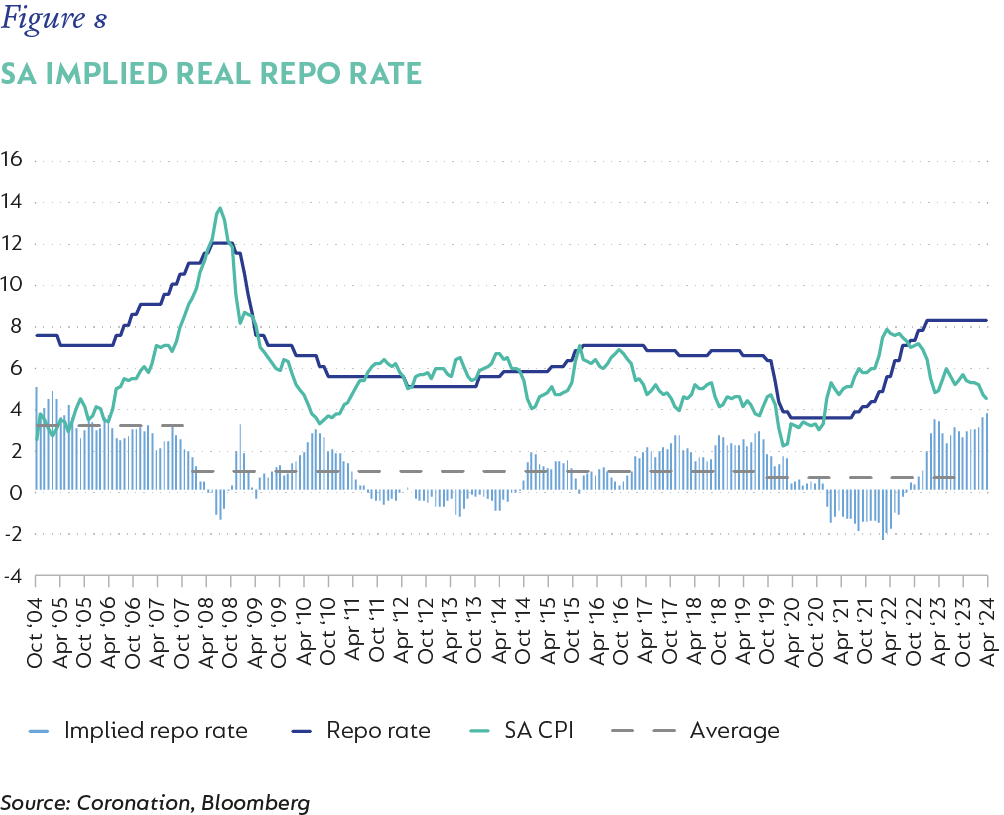
ILBs have had a terrible run relative to nominal bonds given the constant downward revisions to inflation. In addition, with forward inflation expected to touch a low point of 3% soon and average below the midpoint of the inflation band (4.5%) for the majority of the next two years, they remain lacklustre. However, there are two things that continue to warrant including ILBs as part of a portfolio. Firstly, the real policy rate is coming down. At current levels, the coincident real repo rate is close to 4%, while historically this has been closer to 1.5% (Figure 8). The SARB is targeting c. 2.5%, which does suggest there would be significant roll down gains as this is achieved, especially for maturities of around five years. In addition, ILBs provide inherent protection against higher inflation relative to forecast.
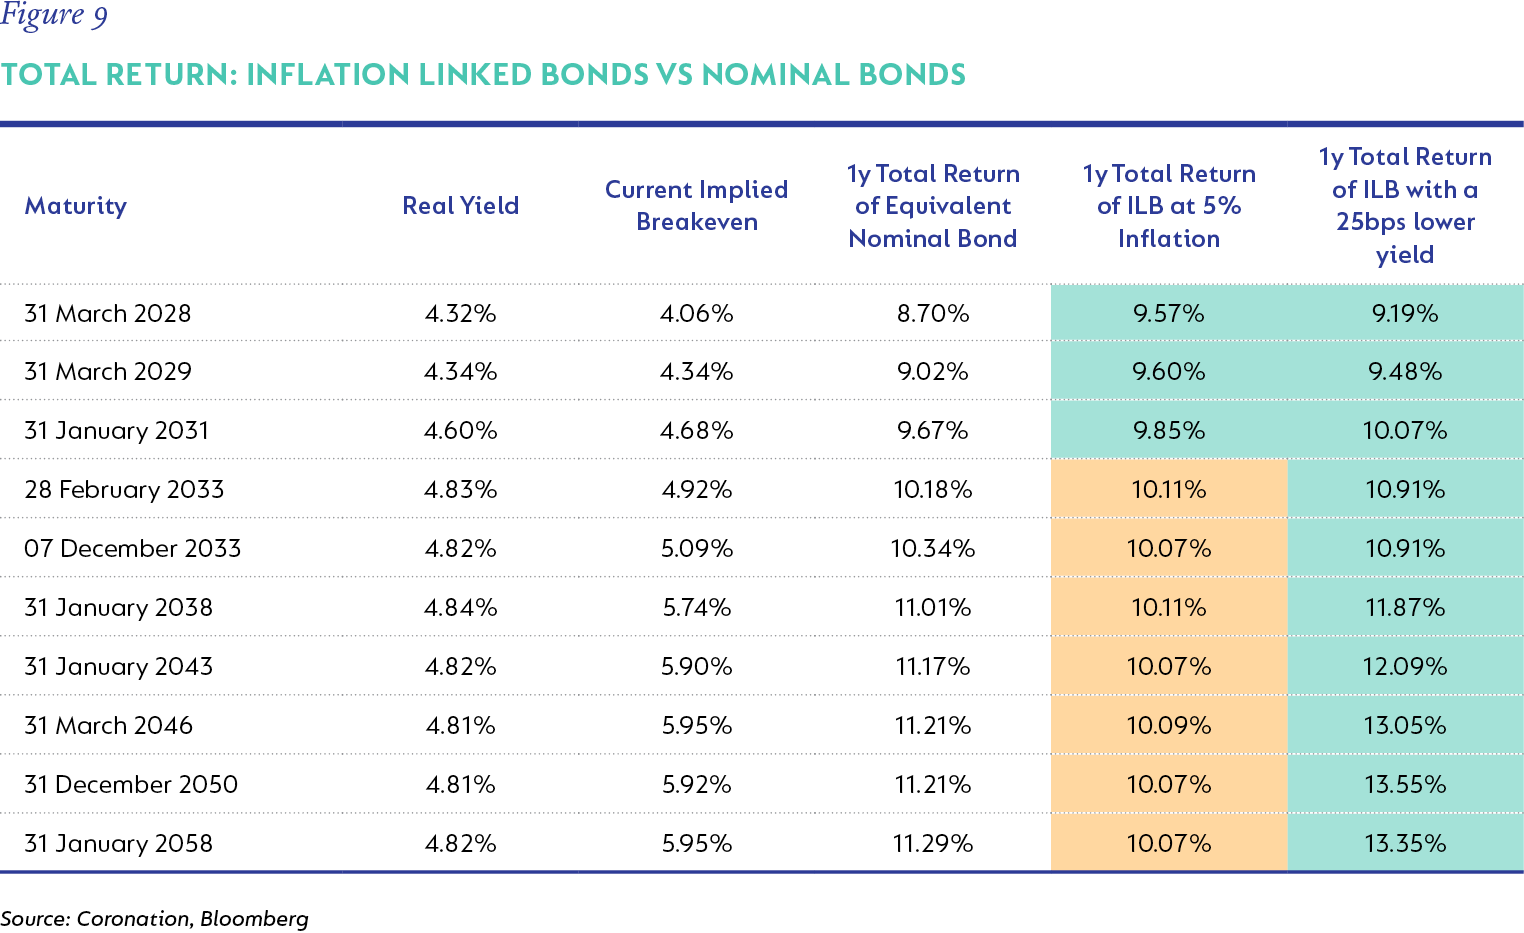
In Figure 9, we show the total return of ILBs over the next year compared to the nominal bond equivalent, assuming inflation averages 5% and then assuming a 25bps reduction in yields across the curve but assuming average inflation of 4% (current forecast). Everything in green is where the ILBs total return exceeds the nominal bond. First, if inflation materialises higher than our 4% estimate, the shorter-dated ILBs up to 2031 maturity offer the best protection. Secondly, if the inflation outcome is as expected but we enjoy some benefit from lower real yields as the policy rate is reduced, then given the higher modified duration of the ILBs, they significantly outperform nominal bonds. However, to this end, we have to consider where the current breakevens (market implied levels for average inflation) are and where they move to if real yields compress 25bps. Here again, it is only bonds out to a 2031 maturity, where breakevens still remain below 5% in the event of a 25bps real yield compression, that flag as attractive relative to the nominal bonds. Therefore, we believe ILBs out to a 2031 maturity still offer value not only due to valuation but also from a risk diversification standpoint.
The global monetary policy easing cycle has boosted the wind in the sails of risky assets’ performance. Global and emerging market bond yields are all significantly lower than at the start of the year. However, current market pricing of interest rate expectations seems ambitious, which suggests global bond yields are well priced at current valuations. SA bonds have enjoyed renewed investor optimism following the formation of the Government of National Unity and on the heels of the global bond rally. SA inflation expectations have reduced significantly but are now fairly priced in through repo rate expectations. The country’s fiscal accounts remain at risk over the longer term and current bond valuations fully discount a more optimistic outcome. ILBs still offer value relative to nominal bonds, if inflation materialises higher than forecast or if real yields follow nominal bond yields lower. Bond portfolios should be positioned neutral duration at current levels with a healthy dose of ILBs for good measure.
Explore Investment Insights on the global economy, markets and topics related to our business.
Subscribe to our Corospondent newsletter